R Demostration 1
In this demonstration, I will go over some basic R syntax as well as how to start utilizing some of the most popular R packages! Remember, all this functionality is completely free!
Task: Download excel workbooks from the Bureau of Labor Statistics and clean them into one combined excel workbook.
We will start my downloading four seperate excel workbooks from the Bureau of Labor Statistics. Follow this link and click the check boxes for the following labor data series indicators in the “Employment” section:
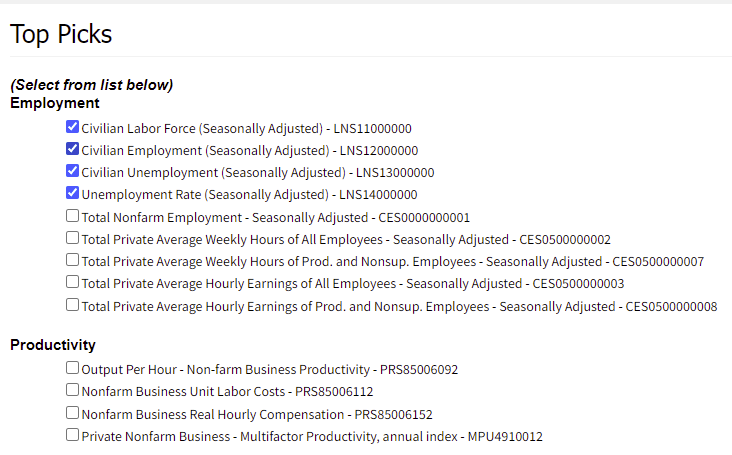
- Civilian Labor Force (Seasonally Adjusted) - LNS11000000
- Civilian Employment (Seasonally Adjusted) - LNS12000000
- Civilian Unemployment (Seasonally Adjusted) - LNS13000000
- Unemployment Rate (Seasonally Adjusted) - LNS14000000
Then scroll down to the bottom of the page and click “Retrieve data”. 
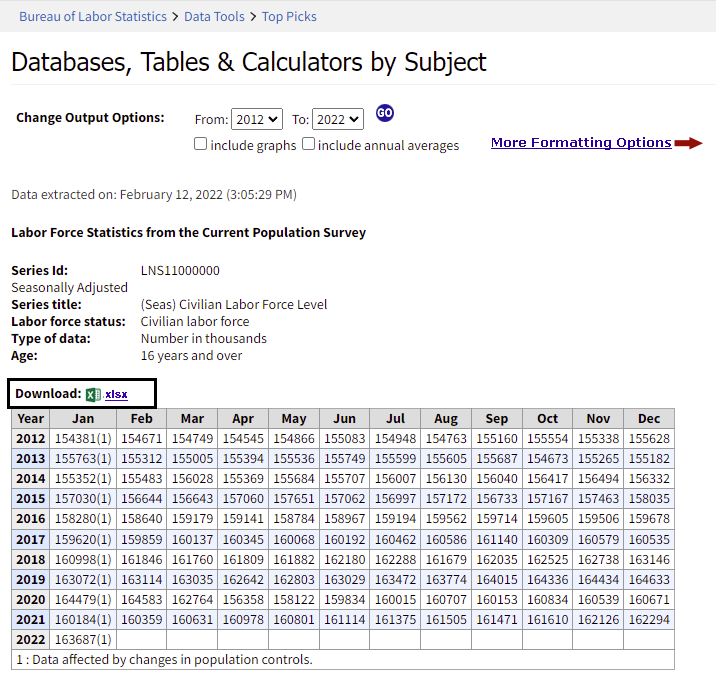
The next page will show you some tables of the four labor labor indicators you chose appear in nice little tables and allow for you to download each of the indicators into their own excel workbook. Download them all and take a quick look at what they currently look like.
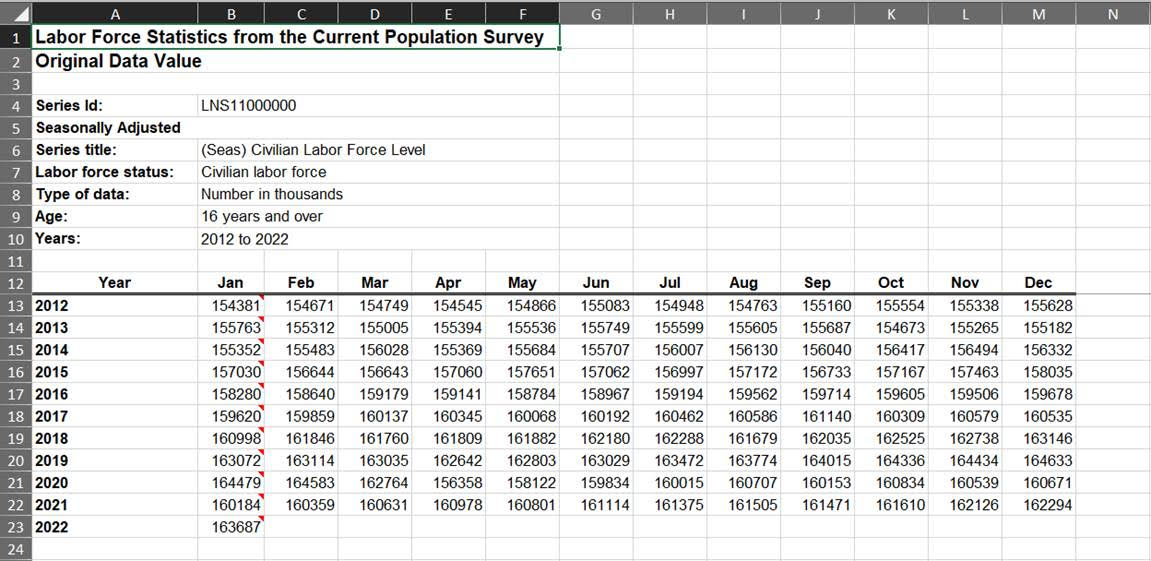
The data does look usable, but it can be difficult to plot if you want to show the change of the US labor force size over time.
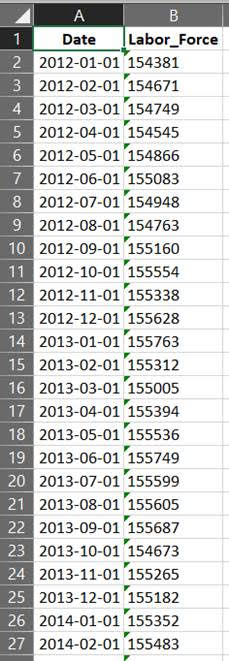
Your task is to clean up these files so they only have two columns each: one for the date and another for the data.
We will be transfering the current “wide data” into “long data” our final output will look like this:
Now, it is important to remember that you can accomplish this task by only using excel -> reshaping the data using tools available in Excel. You do not need to use R to complete this task. Hoewver, if this is a routine task you need to do on a weekly or monthly basis, using R to automate this cleaning process will save you a lot of time and headache in the future. The purpose of “Beginner Coding for Excel Users” is to help Excel users quickly finish their tasks, and even automate them to save time in the future.
Using R to Clean and Organize the Data
Step 1: Save the Excel Files and open RStudio
To start, we first need to save the excel data somewhere we will remember. This is where I am going to save my files and what I am going to name them:
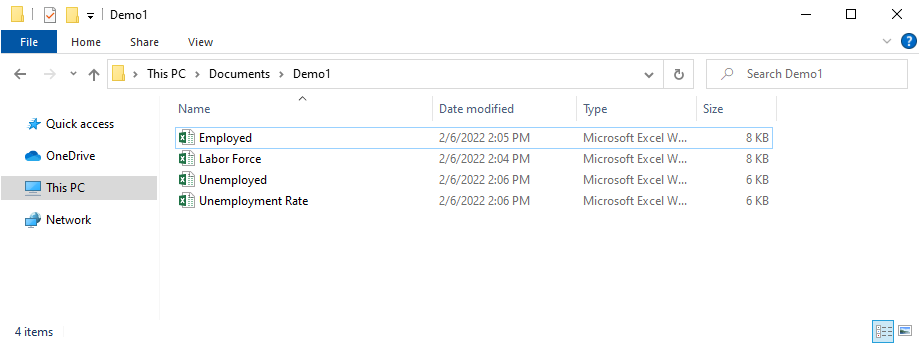
- C:\Users\Owner\Documents\Demo1
- Labor Force.xlsx
- Employment.xlsx
- Unemployment.xlsx
- Unemployment Rate.xlsx
I recommend you use the same file names and locations - this wil make things easier for us later.
Now open up RStudio. If you haven’t installed R and RStudio to your machine before, I recommend you follow the instructions to do so here.
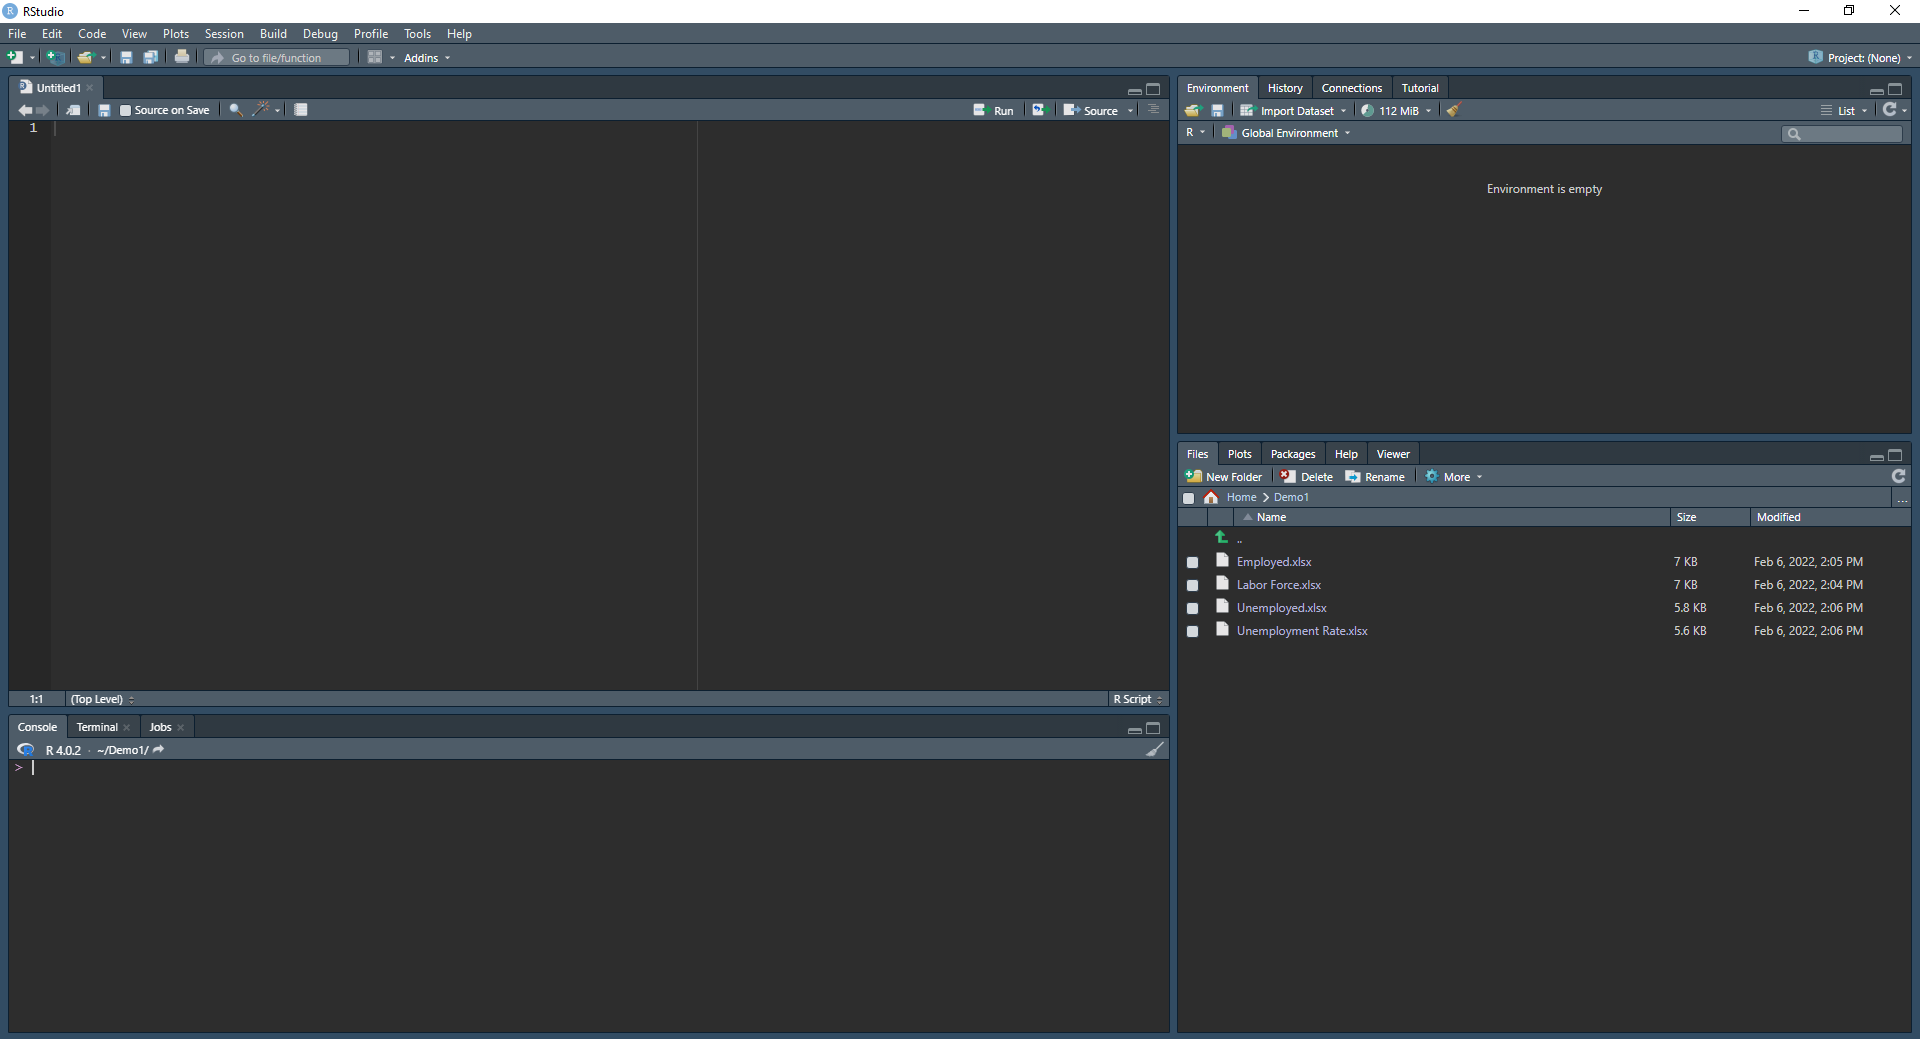
With RStudio open, you might see three distinct panels with different useful information. I recommend watching this video that explains what the different panels are for. Also, to see how to change the default theme to a darker color scheme, see here.
Open a new “R Script” in File -> New File -> R Script if you don’t already have a new one open. A “script” is just a fancy word for the file where you write your code. Our new script is where we are going to write all of our code to complete our task.
Step 2: Import the Data from Excel to R
This is where the fun begins! Time to start using out first R functions!
We will only be walking through how to clean up the “Labor Force.xlsx” data. After successfully cleaning the “Labor Force.xlsx”, you should be able to go back through all the steps and repeat the same processes for the remaining three datasets.
An import thing to remember is there are ways to import data to R by clicking through the bottom right panel and clicking “Import Dataset” when you find what you want to import, but for this demonstration we are gonig to import by writing our own code. This will help us replicate the process when we need to import the other three datasets.
In your new R Script, add the following code:
#Set the working directory. This tells R what folder you will pull the excel files from and where you will save them later.
setwd('C:/Users/Owner/Documents/Demo1')
This function setwd() sets the working directory we are going to be pulling excel data from and where we are going to write the new excel files to, after we finish our task. It is good practice to set the working diretory every time you start a new project You can always click through the prompts with the “Import Dataset” button, but this will take longer and fatigue us if we are importing muliple files at one time.
NOTE: within the setwd() function, you need to have quotatoins around the file path you have your data in. Both single quotations ‘’ and double quorations “” read the same in R, so use whichever you are more comfortable with. I will be using single quotations. Also, the backslashes in teh filepath C:\Users\Owner\Documents\Demo1 will need to be changed to forward slashes C:/Users/Owner/Documents/Demo1. This is a common syntax error that will trip a lot of people up.
Also, anytime you see a bunch of text following a # just know that those lines are “commented out” which means they are just text for the users to read. They will not be treated as R functions - they’re a quick and easy way to leave yourself notes and remind yourself what you are doing when you are using differnet commands.
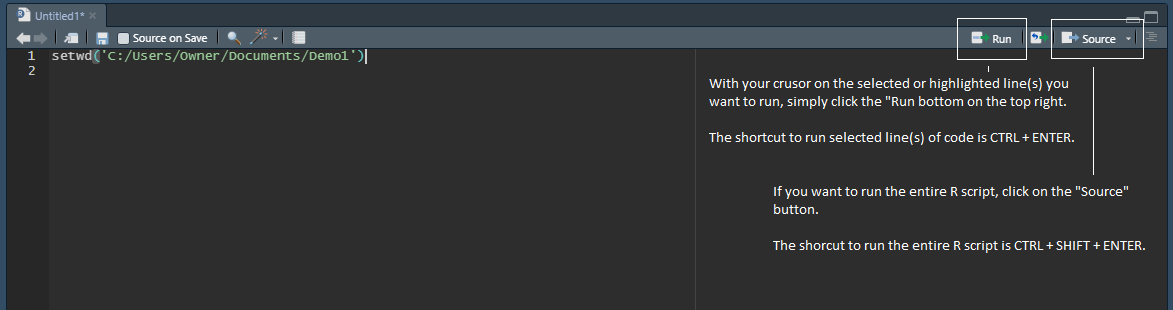
To run the setwd() function, make sure the blinking indicator is on the line you want to run and click the “Run” button at the top right of the R script. The shortcut key to run the script is also CTRL + ENTER. See the above image for more.
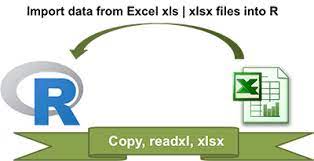
After we set the correct working directory, we will need to import the data to R. To do this, we will need to install our first R packages.
Packages are their own unique groups of functions that can accomplish many different things. There are R packages out there that can simulate bird flying patterns, to play texas hold em poker, and even allow you to calculate baseball player statistics. In fact, there are over 10,000 R packages available for you to downlaod and play with!!! We do not need all 10,000 packages to be downloaded to our machine at one given time, so we will only use the ones we need, when we need them. To fuel your curosity, here is where you can find all the official R packages. There are even unofficial packages listed elsewhere!
Think of each R package as one of the tabs you see in Microsoft Excel. You have some by default -> “Home”, “Insert”, and “Page Layout”, but you can also add some additional ones like “Analysis ToolPak”. Every R package is like it’s own new Excel tab that includes its own unique features.
Add the following line to your script to download the packages we will need for this project.
#Install the packages below to make sure you have them in RStudio.
#Note that you need to use quotes around the name of the package you want to download.
install.packages('readxl')
install.packages('writexl')
install.packages('dplyr')
install.packages('tidyr')
Do not worry about the names of the packages - I know they look a little silly, but I will address each one as we use them later on. Run these lines of code and if you get a prompt that asks you to restart your R session, click yes - this will just insure the installiation is complete.
It is important to know that YOU ONLY NEED TO INSTALL R PACKAES ONE TIME. You need to download these packages if you don’t already have them on your machine, but if you already have them downloaded, you don’t need to re-install them over and over again.
After installing the package above, we need to make sure they are active. Since there are over 10,000 R packages available for use and lets say you have 500 downloaded in your RStudio, it is unecessary for RStudio to have all 500 packages active every time you use R if you only need to use 10 at a time. Imagine you have every Microsoft Office product open and running in the background, but you only need to use a few of them at a time. Imagine the extra computing power you are using to have the unused programs running!
To make sure the packages we need are up and running, add the following code to your R script:
#Open the packages you just downloaded by using the 'library()' function.
library(readxl)
library(writexl)
library(dplyr)
library(tidyr)
The library() function opens the R package you want. Note that when you need to install a package, you need quotations around the name of the package, and when you are opening the package, you do not need the quotations.
If you opened one of the packages above, lets say dplyr, and it says the package is not found, you need to go back up and make sure you run the install.package('dplyr') command.
Now that we have the packages set up we can finally import our “Labor Force.xlsx” data! Run the following line of code to import the data and save it in the object lf_og.
#Import your Excel file with the `read_xlsx()` function from the 'readxl' package.
#Save it as the object `lf_og` (short for labor force, original).
lf_og <- read_xlsx('Labor Force.xlsx')
#Explain what an object is in R
#Add this link to share more about the read_xlsx()
http://www.sthda.com/english/wiki/reading-data-from-excel-files-xls-xlsx-into-r
library(readxl)
library(writexl)
library(dplyr)
library(tidyr)